Alert Doctor
Praxis Alert Doctor continuously reviews and refines a project's shared Prometheus alerting rules, proposing changes and applying them safely and reversibly when enabled.
What It Does
Alerts should mean something. Stop getting paged for nothing. Alert Doctor kills noisy alerts, fixes broken thresholds, and closes the coverage gaps that leave real incidents silent.
Alert rules are written once and rot forever: thresholds nobody revisits, duplicates that double-page, latched counters that burn for a day, and silent gaps where real incidents page nobody. Alert Doctor treats your rules like a patient: recurring checkups, evidence-based treatment, and a second opinion on every change.
Each checkup is a single cycle in one of two roles, and the two roles alternate from one checkup to the next:
- A Proposer checkup reads the live signal, diagnoses what it finds, and drafts a treatment. When Auto-apply is on, it also edits the project's shared alert rules, snapshots the prior state for rollback, and a follow-up check confirms the change reached Prometheus.
- A Judge checkup audits the previous Proposer checkup against the raw signal, then keeps, reverts, or adjusts each change and leaves guidance for the next one.
Applying and verifying happen only on a Proposer checkup, and only when Auto-apply is on. Otherwise every checkup is advice only. The Judge's feedback folds into the next Proposer checkup, so the loop keeps tightening over time.
Alert Doctor is a Praxis app, currently in beta. It runs only in Facets authentication mode, so it does not appear in a general-auth deployment, and it is enabled per organization from Apps in settings. Each case is scoped to a single blueprint, the Facets environment configuration for one project, and tunes that project's shared Prometheus alert rules.
Core Capabilities
Evidence-based diagnosis. Every checkup reads a full signal window across all of the project's environments (every alert fire, metric series, and incident report) and identifies four patterns:
- Flappers: many short fires that self-resolve (needs a longer
forwindow) - Constant burners: one fire burning the whole window (a wrong threshold or a latched counter)
- Duplicates: two rules paging for the same failure
- Coverage gaps: incidents where no alert was firing within ±30 minutes
Deliberated treatment. Before any change ships, the model argues every candidate both ways: the evidence for it, and the strongest honest case against it. A candidate whose counter-argument wins is dropped, and dropped ideas stay visible as an audit trail. Every surviving change cites the exact fires, burn time, or incident that justifies it.
Safe write-back. Auto-apply is opt-in. When enabled:
- Changes edit the project's shared alert rules once and release to every selected environment.
- Every write keeps a rollback snapshot.
- A confirmer verifies each rule is actually live in Prometheus afterward. A change that didn't land everywhere is reported honestly as drift, never assumed.
Until you enable Auto-apply, checkups are advice only.
Independent audit. Checkups alternate between two roles. The Proposer drafts and applies refinements; the Judge, a separate model, audits the previous checkup against the raw signal:
- Flags claims the signal contradicts (grounding errors)
- Rules each change keep, revert, or adjust
- Leaves suggestions the Proposer must answer in the next checkup
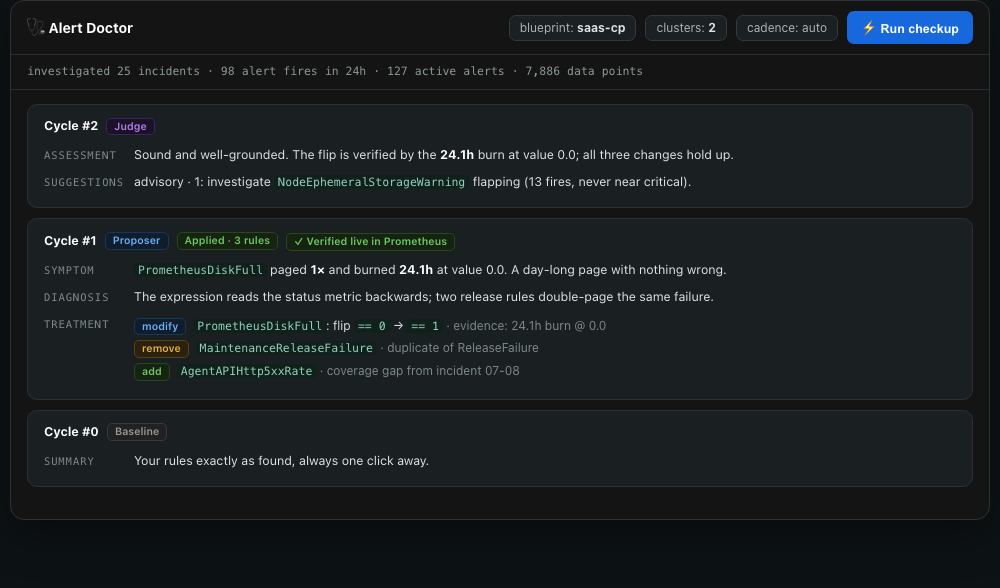
The Judge never writes; the Proposer never self-approves.
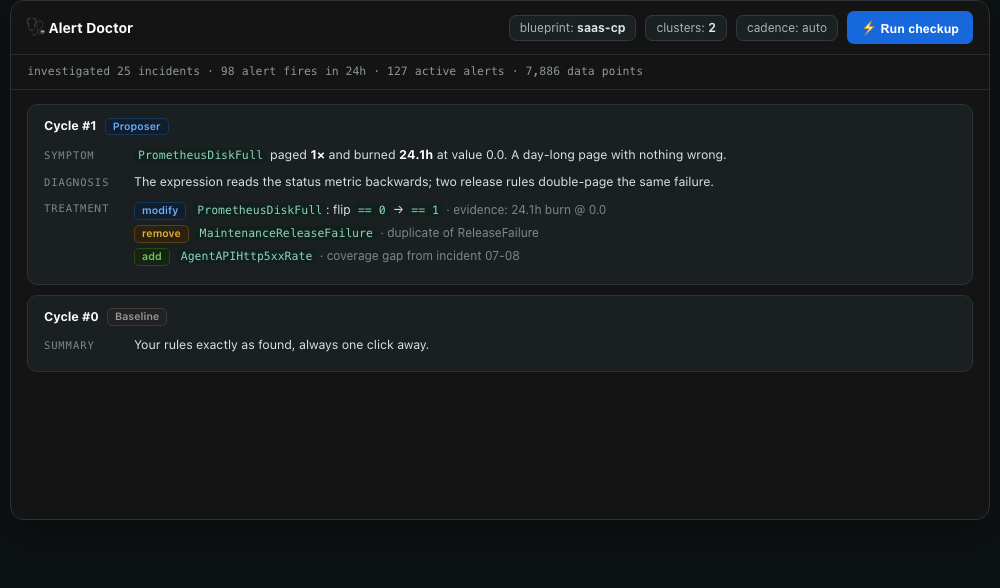
One-click restore. Cycle #0 records your rules exactly as found, before the doctor's first checkup. Restore returns the doctor's working rule set, its recommendation baseline, to any earlier cycle's state in one click. It appends that earlier state as the doctor's current recommendation; it does not release anything to live Prometheus. Only rollback re-releases a change to your live environments.
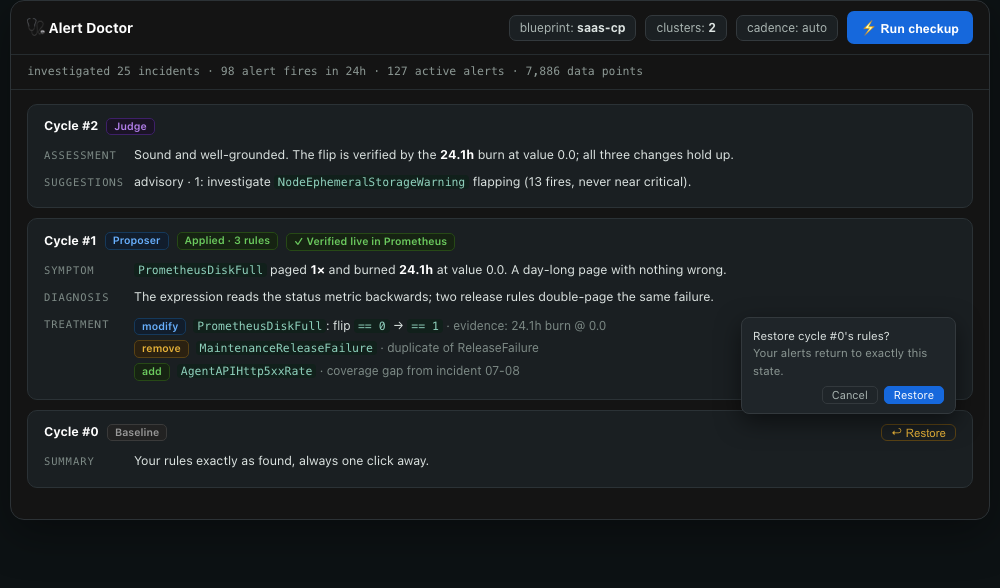
Restore differs from rollback: Restore can jump to any earlier cycle and moves only the doctor's recommendation baseline, while rollback undoes the single latest applied change and re-verifies that the undo is live in Prometheus.
Scope safety. Rules owned by the platform, or defined by multiple alert groups, are read-only. The doctor sees their signal as context but never modifies or removes them. A checkup that produces no usable output fails loudly with the real cause, instead of quietly recording "no changes."
Adaptive frequency. Left on Auto, the schedule ramps down as alerting stabilizes, driven by the count of completed checkups rather than elapsed time: 3 hourly checkups, then five 4-hour checkups through the first day, then 5 daily checkups, then weekly from the fourteenth on. Because it counts checkups instead of wall-clock time, pausing a case or changing its frequency resumes the ramp where it left off. Hourly, Daily, and Weekly fixed frequencies are also available, and you can trigger an on-demand checkup at any time. On-demand checkups do not advance the Auto ramp.
How to Set It Up
-
Open Alert Doctor and pick the project you want treated.
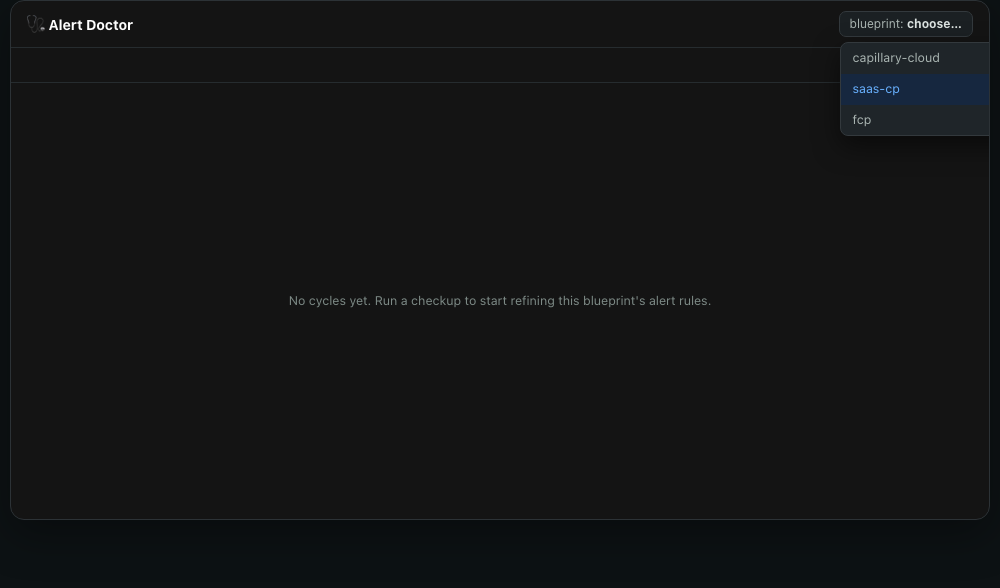
-
Choose observation points: the environments to observe. Rules are edited once and released to every environment you select.
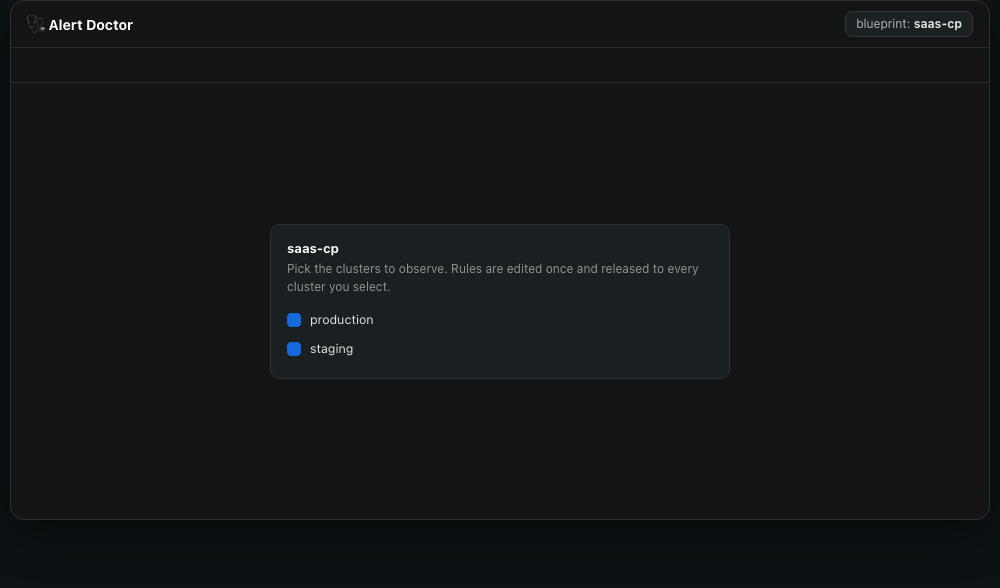
If the project is already managed by another case, Alert Doctor rejects the request and names the existing case instead.
-
That's it. The doctor discovers each environment's Prometheus and your incident history on its own, records the Cycle #0 baseline, and is ready for its first checkup.
-
Read the first proposal. Nothing in your environments changes until you opt in.
-
Arm the case with the Active toggle to run checkups on a schedule. Until you do, the doctor runs only when you trigger a checkup by hand. Arming is separate from write-back: an armed case still only proposes changes.
-
To let the doctor apply its changes on its own, also enable Auto-apply. Turning Active off later pauses scheduled checkups and turns Auto-apply off with it.
Once a case is running, more controls are available from its dashboard:
- Frequency: choose Auto, Hourly, Daily, or Weekly. Auto is the adaptive schedule described in Core Capabilities.
- Business need: type what the next checkup should prioritize into the free-text field, which prompts you to
Target this checkup.... The separate Focus next row is read-only and shows the Judge's guidance for the next checkup, not anything you type. - Auto-apply: toggle it on and confirm in the Enable auto-apply dialog. Every Proposer checkup then edits the shared rule base, releases it to every environment in the set, and verifies the change landed. The toggle reads Staying in Praxis when off and Override + release each cycle when on.
- Roll back or re-release: use Roll back to undo the latest applied checkup. You'll be asked why, and that reason is recorded in the audit report. Use Re-release to retry a change that failed to land or drifted.
- Linked incident workspace (optional): supply a workspace URL and an API key (username optional) so its incident reports feed the doctor's signal alongside the local incident store. Linking without an API key is rejected.
- PDF export: export a report reviewing every change Alert Doctor has made to a project's alert rules.
- Pause or delete: pausing (the Active toggle) stops scheduled checkups without losing the case's history or its place in the schedule. Deleting forgets the case entirely.
Deleting a case removes only Alert Doctor's history and configuration for that project. It does NOT revert any live alert rules the case already applied to your environments.
Example Checkup
Cycle #1 · Proposer                    Applied · 3 rules · Verified live

SYMPTOM     PrometheusDiskFull paged 1x and burned 24.1h at value 0.0.
            A day-long page with nothing wrong.

DIAGNOSIS   The expression reads the status metric's polarity backwards;
            two release rules double-page the same failure.

TREATMENT   modify  PrometheusDiskFull: flip == 0 to == 1
                    evidence: 24.1h burn @ 0.0
            remove  MaintenanceReleaseFailure: duplicate of ReleaseFailure
            add     AgentAPIHttp5xxRate: coverage gap from incident 07-08

Cycle #2 · Judge

ASSESSMENT  Sound and well-grounded. The flip is verified by the 24.1h
            burn at value 0.0; all three changes hold up.

SUGGESTIONS advisory · 1: investigate NodeEphemeralStorageWarning flapping
            (13 fires, never near critical).
How It Differs from Incident Responder
| Scenario | Use |
|---|---|
| An active incident is affecting production right now | Incident Responder |
| My pager fires constantly and most of it is noise | Alert Doctor |
| A real outage happened and no alert fired | Alert Doctor |
| I need root cause for a specific failure | Incident Responder |
| I want my alert rules to stay tuned without manual review | Alert Doctor |
Incident Responder is reactive: it investigates what already broke. Alert Doctor is proactive: it continuously tunes the rules so the right things page you in the first place. They compound: Alert Doctor reads Incident Responder's incident history to find coverage gaps.
How It Works
A case observes a flat, equal set of environments under one project. There is no privileged "anchor" environment.
Each checkup is one model call, with no tool use, fed a pre-fetched signal: the current Prometheus rules, time-series evidence, and recent incident reports. Every checkup takes one of two roles, and the roles alternate:
- Proposer: a faster model that works like a clinician. It states a symptom and diagnosis, weighs differential diagnoses, argues every candidate change both for and against, then emits a patch of additions, removals, or modifications backed by cited evidence. When Auto-apply is on it applies the patch, and a follow-up check confirms it. It reads the previous Judge checkup's feedback as memory.
- Judge: a stronger model that reviews the Proposer's last checkup against the signal and returns structured feedback. The Judge never applies or writes anything itself.
A checkup's role is set from the last completed refinement, not from the cycle number, so a restore or a failed checkup never knocks the Proposer/Judge rhythm out of step.
The loop works toward three standing goals:
- Add coverage where a real failure has no alert.
- Remove alerts that are useless, duplicate, or dead.
- Tune alerts that are right in spirit but need threshold, window, scope, or severity adjustment.
The signal lookback window scales with the checkup frequency (roughly a day for Auto or Hourly, a week for Daily, two weeks for Weekly) and always covers at least the time since the last run, capped at 14 days. This keeps a paused-and-resumed case from developing a blind spot.
Scheduling runs as a periodic sweep across every organization's cases, skipping organizations over their usage cap.
When Auto-apply is on, a release runs through these steps:
- Alert Doctor edits the project's shared alert rule definitions exactly once per cycle, so every environment in the set inherits the change.
- It snapshots the prior state first, so the change can be rolled back later.
- It releases each environment in the set one by one.
- Rule changes are grouped by which underlying resource owns each rule. A rule owned by more than one resource, or a platform-managed rule with no editable owner, is automatically skipped rather than written.
- A background step re-reads each environment's live Prometheus rules to confirm the write actually landed, rather than trusting the release call alone.
- Each change is stamped confirmed true, false, or null, and the cycle gets an overall status.
Cycle status after a release:
| State (shown in the UI) | Meaning | How you get there |
|---|---|---|
| Confirmed in Prometheus | The change released and was verified on every environment in the set. | A full release lands, and every environment's live Prometheus rules match it. |
| Released, but Prometheus doesn't match | The change released to some environments but not others. | At least one environment's live rules don't match after release, a partial release. |
| Release failed | The shared base edit saved, but the control-plane release errored before it could reach Prometheus. | A release call fails outright, for example an unreachable environment; the affected environment is marked separately from a drift. |
| Saved (deploys on next release) | The change saved to the shared rule base but hasn't released yet. | A checkup applies the edit without triggering a release, or a release is still pending. |
| Not applied (base edit rejected) | The rule edit itself was rejected and never saved. | The shared alert rule edit failed validation or write. |
Rollback restores the prior snapshot and re-releases it. Only the single latest applied, non-reverted cycle can be rolled back, to avoid clobbering newer changes. Re-release retries pushing an already-applied change without re-editing the base, useful after a partial release or an unreachable environment.
Safety Boundaries
Praxis defaults to read-only and asks a human before it changes anything. Alert Doctor is the deliberate exception: it is the one Praxis app that writes, editing a project's Prometheus alert rules and then verifying each write landed. Everything about how Praxis executes, scopes, and audits that work is shared, and is covered in How Praxis works. This section covers the boundaries specific to Alert Doctor.
Within that shared model, Alert Doctor's writes stay narrow and reversible, and it never touches anything beyond a project's alerting rules.
- Auto-apply is off by default and requires an explicit, separately confirmed opt-in per case. While off, Alert Doctor only proposes changes and never touches a live environment.
- Narrow write scope. Even when enabled, Alert Doctor only ever edits the shared alert-rule resource's definitions. It does not touch other Kubernetes resources, restart workloads, or deploy application code.
- The Judge never writes. Only the Proposer cycle can apply a change; the Judge cycle only reviews and gives feedback.
- Ambiguous rules are skipped, not guessed at. Rules owned by more than one resource, or platform-managed rules with no editable owner, are automatically skipped rather than modified.
- Read-only cluster discovery. The Kubernetes client used for Prometheus discovery is read-only: list and proxy-GET only, with no write path.
- Release-then-confirm. Every write is re-verified by re-reading live Prometheus, rather than trusting the write call alone.
- Every applied cycle is reversible. Rollback is always available, though only the latest applied cycle can be rolled back, an explicit guard against clobbering newer state.
- Deleting a case does not undo its changes. Deleting a case removes only Alert Doctor's own history and configuration. It does NOT revert the environments' already-applied live alert rules.
- Concurrency and usage limits are enforced. Organization-level usage caps gate the unattended scheduler loop, and a single-flight lease prevents two operations (checkup, delete, rollback) from running concurrently on the same case.
Integrations
- Facets Control Plane: the read path for project and environment metadata, and the sole write path for pushing rule changes and releasing environments. Every control-plane operation runs automatically during a checkup when Auto-apply is on.
- Prometheus: read for the current alerting rules and time-series evidence during every checkup, and the target that post-release confirmation re-reads to prove a change landed.
- Praxis incident reports: an optional additional signal source, either the local incident store when Alert Doctor runs inside the same Praxis deployment as Incident Responder, or a linked remote Praxis workspace's incidents API, connected by supplying a URL and API key, plus an optional username.
- Kubernetes API (via a downloaded Facets kubeconfig): read-only, used only to auto-discover the in-cluster Prometheus service. It is not a general troubleshooting interface.
Unlike Incident Responder, Alert Doctor has no Slack, Microsoft Teams, Mattermost, email, or other chat and notification integration. Checkup results surface only in the case dashboard and PDF export.
Tip: You can also perform case management, checkups, rollback, and PDF reporting programmatically. See the API Reference for details.
Permissions
Every action requires an authenticated Praxis session and is scoped to your organization, following the shared access model in How Praxis works. Alert Doctor reads environments and writes rules through your organization's Facets integration credential, falling back to your own personal access token when that is the only credential the organization has configured. It has no separate in-app roles such as admin or viewer beyond requiring an authenticated organization member.
Troubleshooting
| Problem | What happens |
|---|---|
| A malformed blueprint id, missing a separator or with an empty segment | Rejected at the route boundary with a 422, rather than persisted. |
| Starting a second case on an already-managed project | Rejected with a 409 naming the existing case. |
| Deleting or rolling back a case while a checkup is in progress | Rejected with a 409, asking you to retry once the checkup finishes. |
| Running a checkup while the organization is over its usage cap | An on-demand run is rejected with a 402. The scheduled sweep silently skips the organization instead of erroring. |
| Rollback or re-release attempted on any cycle other than the latest applied one | Rejected with a 409 and an explanation. |
| Linking a remote incident workspace without an API key | Rejected with a 422. |
| A rollback that fails | Returns a 502, but the rollback snapshot is kept so it can be retried. |
| A signal source (Prometheus, Facets Control Plane, or Kubernetes) fails | That source degrades to a disconnected status with an empty signal, instead of failing the whole cycle. A source that's connected but reporting zero signal is flagged as a warning rather than a plain success. |
| Rule changes skipped during apply, due to ambiguous ownership or unmapped environments | Surfaced in the apply report's skipped list with per-item detail, shown as an "N skipped" tag with a tooltip. |
Related
- Incident Responder - Correlates Kubernetes, cloud, and log signals to diagnose infrastructure incidents; Alert Doctor can optionally consume its incident reports as an extra signal.
- K8s Inspector - Natural-language Kubernetes troubleshooting, conceptually adjacent but narrowly focused here on tuning the shared Prometheus alert rule set rather than open-ended cluster Q&A.
- Debug a failed release - Diagnoses failed deployments with the same evidence-first, symptom-and-diagnosis framing Alert Doctor's clinical readout uses, but for release failures rather than alerting-rule quality.
- API Reference - Programmatic access to case management, checkups, rollback, and PDF reports.
Incident Responder
Praxis Incident Responder detects, diagnoses, and resolves infrastructure and deployment incidents by correlating Kubernetes, cloud, and log signals.
Duties
Give a Praxis agent standing work it runs unattended, whether on a schedule, watching a Slack channel, or fired by a webhook, so it monitors your systems and reports back without changing them.