Incident Responder
Praxis Incident Responder detects, diagnoses, and resolves infrastructure and deployment incidents by correlating Kubernetes, cloud, and log signals.
What it is
Incident Responder is a Praxis app that accelerates detection, diagnosis, and resolution of infrastructure and deployment incidents. It bridges the gap between alert noise and root-cause clarity by correlating signals across Kubernetes, cloud infrastructure, deployment history, and application logs, in real time.
Investigation starts the moment an alert arrives, whether from a connected Slack, Mattermost, or Microsoft Teams channel, a generic webhook (PagerDuty, OpsGenie, Datadog, Prometheus, or a custom sender), or a manually created incident. Teams organize this work inside a workspace: an isolated space scoped to a team or product, so incident history and configuration for one team never mixes with another's.
Incident Responder is a beta app. Turn it on per organization from Apps in settings. It works with or without a Facets connection, and each workspace keeps its own incidents, triggers, and sources. Investigation is read-only: Praxis diagnoses and recommends, but never changes your systems.
Core Capabilities
- Deployment Failure Diagnosis Praxis inspects failed releases end-to-end: pulling structured error traces from release logs, correlating them with resource configurations, and surfacing the likely failure domain (misconfiguration, dependency timeout, infra drift, image pull failure, etc.).
- Kubernetes Incident Investigation Using read-only cluster access, Praxis queries pod states, events, resource limits, and container logs across namespaces. It identifies CrashLoopBackOffs, OOMKills, scheduling failures, and misconfigured probes without requiring direct kubectl access from users.
- Log-Driven Root Cause Analysis The built-in log analysis pipeline ingests raw release and runtime logs, extracts actionable error signals, strips noise, and returns a structured diagnosis, including probable cause, affected resources, and recommended remediation steps.
- Cross-Layer Correlation Praxis connects dots across layers: a Kubernetes pod failure may trace back to a Terraform misconfiguration, a missing environment variable, or a broken dependency chain. It reasons across the full Facets resource graph to identify upstream causes.
- Alert Deduplication & Triage When a new alert arrives, Praxis compares it against every currently open incident in the workspace and classifies it as new, a duplicate, or downstream of an existing incident. Duplicates and downstream alerts are linked to the original incident instead of starting a new investigation, so a storm of related alerts collapses into a single tracked incident rather than flooding a channel with repeats.
- Self-Verification (Devil's-Advocate) Before Praxis reports a root cause, an independent sub-agent tries to disprove it using only the raw evidence, checking whether the signature the hypothesis predicts actually matches what was observed. A hypothesis that cannot survive this challenge is reported with lower confidence rather than presented as certain.
- Guided Remediation Praxis recommends targeted remediation actions, for example correcting a resource configuration or escalating to the team that owns a dependency. Praxis never executes these actions itself: it always leaves the decision, and the action, to a human.
How It Works
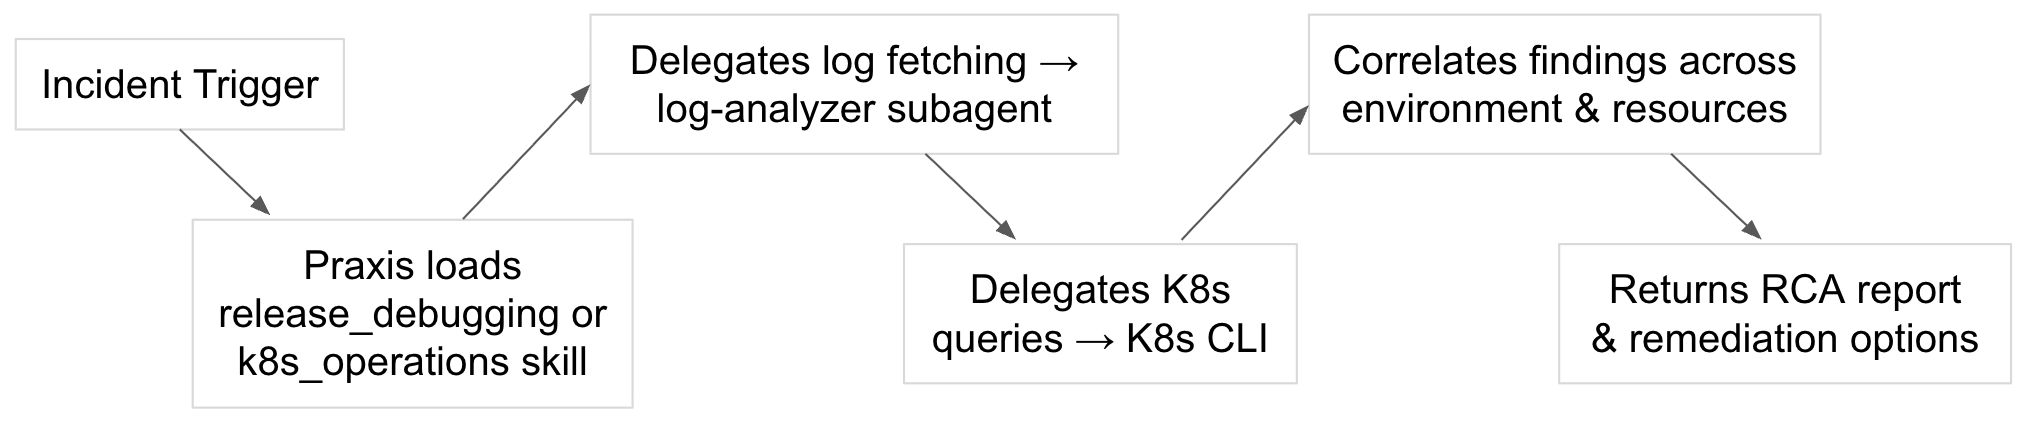
When an alert arrives, Praxis compares it against every incident currently open in the workspace. If the alert describes a new problem, Praxis starts a fresh investigation. If it is a duplicate of, or downstream from, an incident already being investigated, Praxis links it to that incident instead of investigating again. This is what keeps an alert storm from becoming dozens of separate incidents. If the classification step itself fails, Praxis falls back to investigating directly rather than leaving the alert untouched.
To investigate, Praxis gathers a snapshot of the relevant Facets project and environment, pulls in context from related open incidents and past resolved incidents for the same service, confirms the organization is within its usage limits, and then runs its AI SRE agent with read-only access to the systems it needs to inspect.
The agent's investigation methodology starts broad and narrows down:
- Start broad. Check recent releases, then pod status, pod descriptions, logs, and events for the affected service.
- Correlate with timing. Check whether a recent deployment change lines up with when the incident started.
- Match known patterns. Look for signatures of common failure modes: OOMKilled, CrashLoopBackOff, ImagePullBackOff, pods stuck Pending, or recurring log errors.
- Chain the root cause. Build a causal chain by repeatedly asking "why": the symptom, its immediate cause, the root cause behind that, and what ultimately triggered it.
- Challenge the hypothesis. Before submitting a result, an independent sub-agent tries to refute the root-cause hypothesis using only the raw evidence, not the investigating agent's own reasoning. This runs for up to three rounds.
- Report with calibrated confidence. If the hypothesis holds up, Praxis reports it with its earned confidence level. If it is still unresolved after three rounds of challenge, Praxis is allowed to submit anyway, but confidence is forced down to low and the incident is flagged as unresolved at the retry cap.
Praxis also draws on a catalog of discovered infrastructure (services, databases, caches, queues, and their dependencies) to enrich its understanding of what an affected resource connects to during investigation.
The Incident Workspace
Everything Incident Responder tracks lives inside a workspace: an isolated space for one team or product's incidents, triggers, and sources.
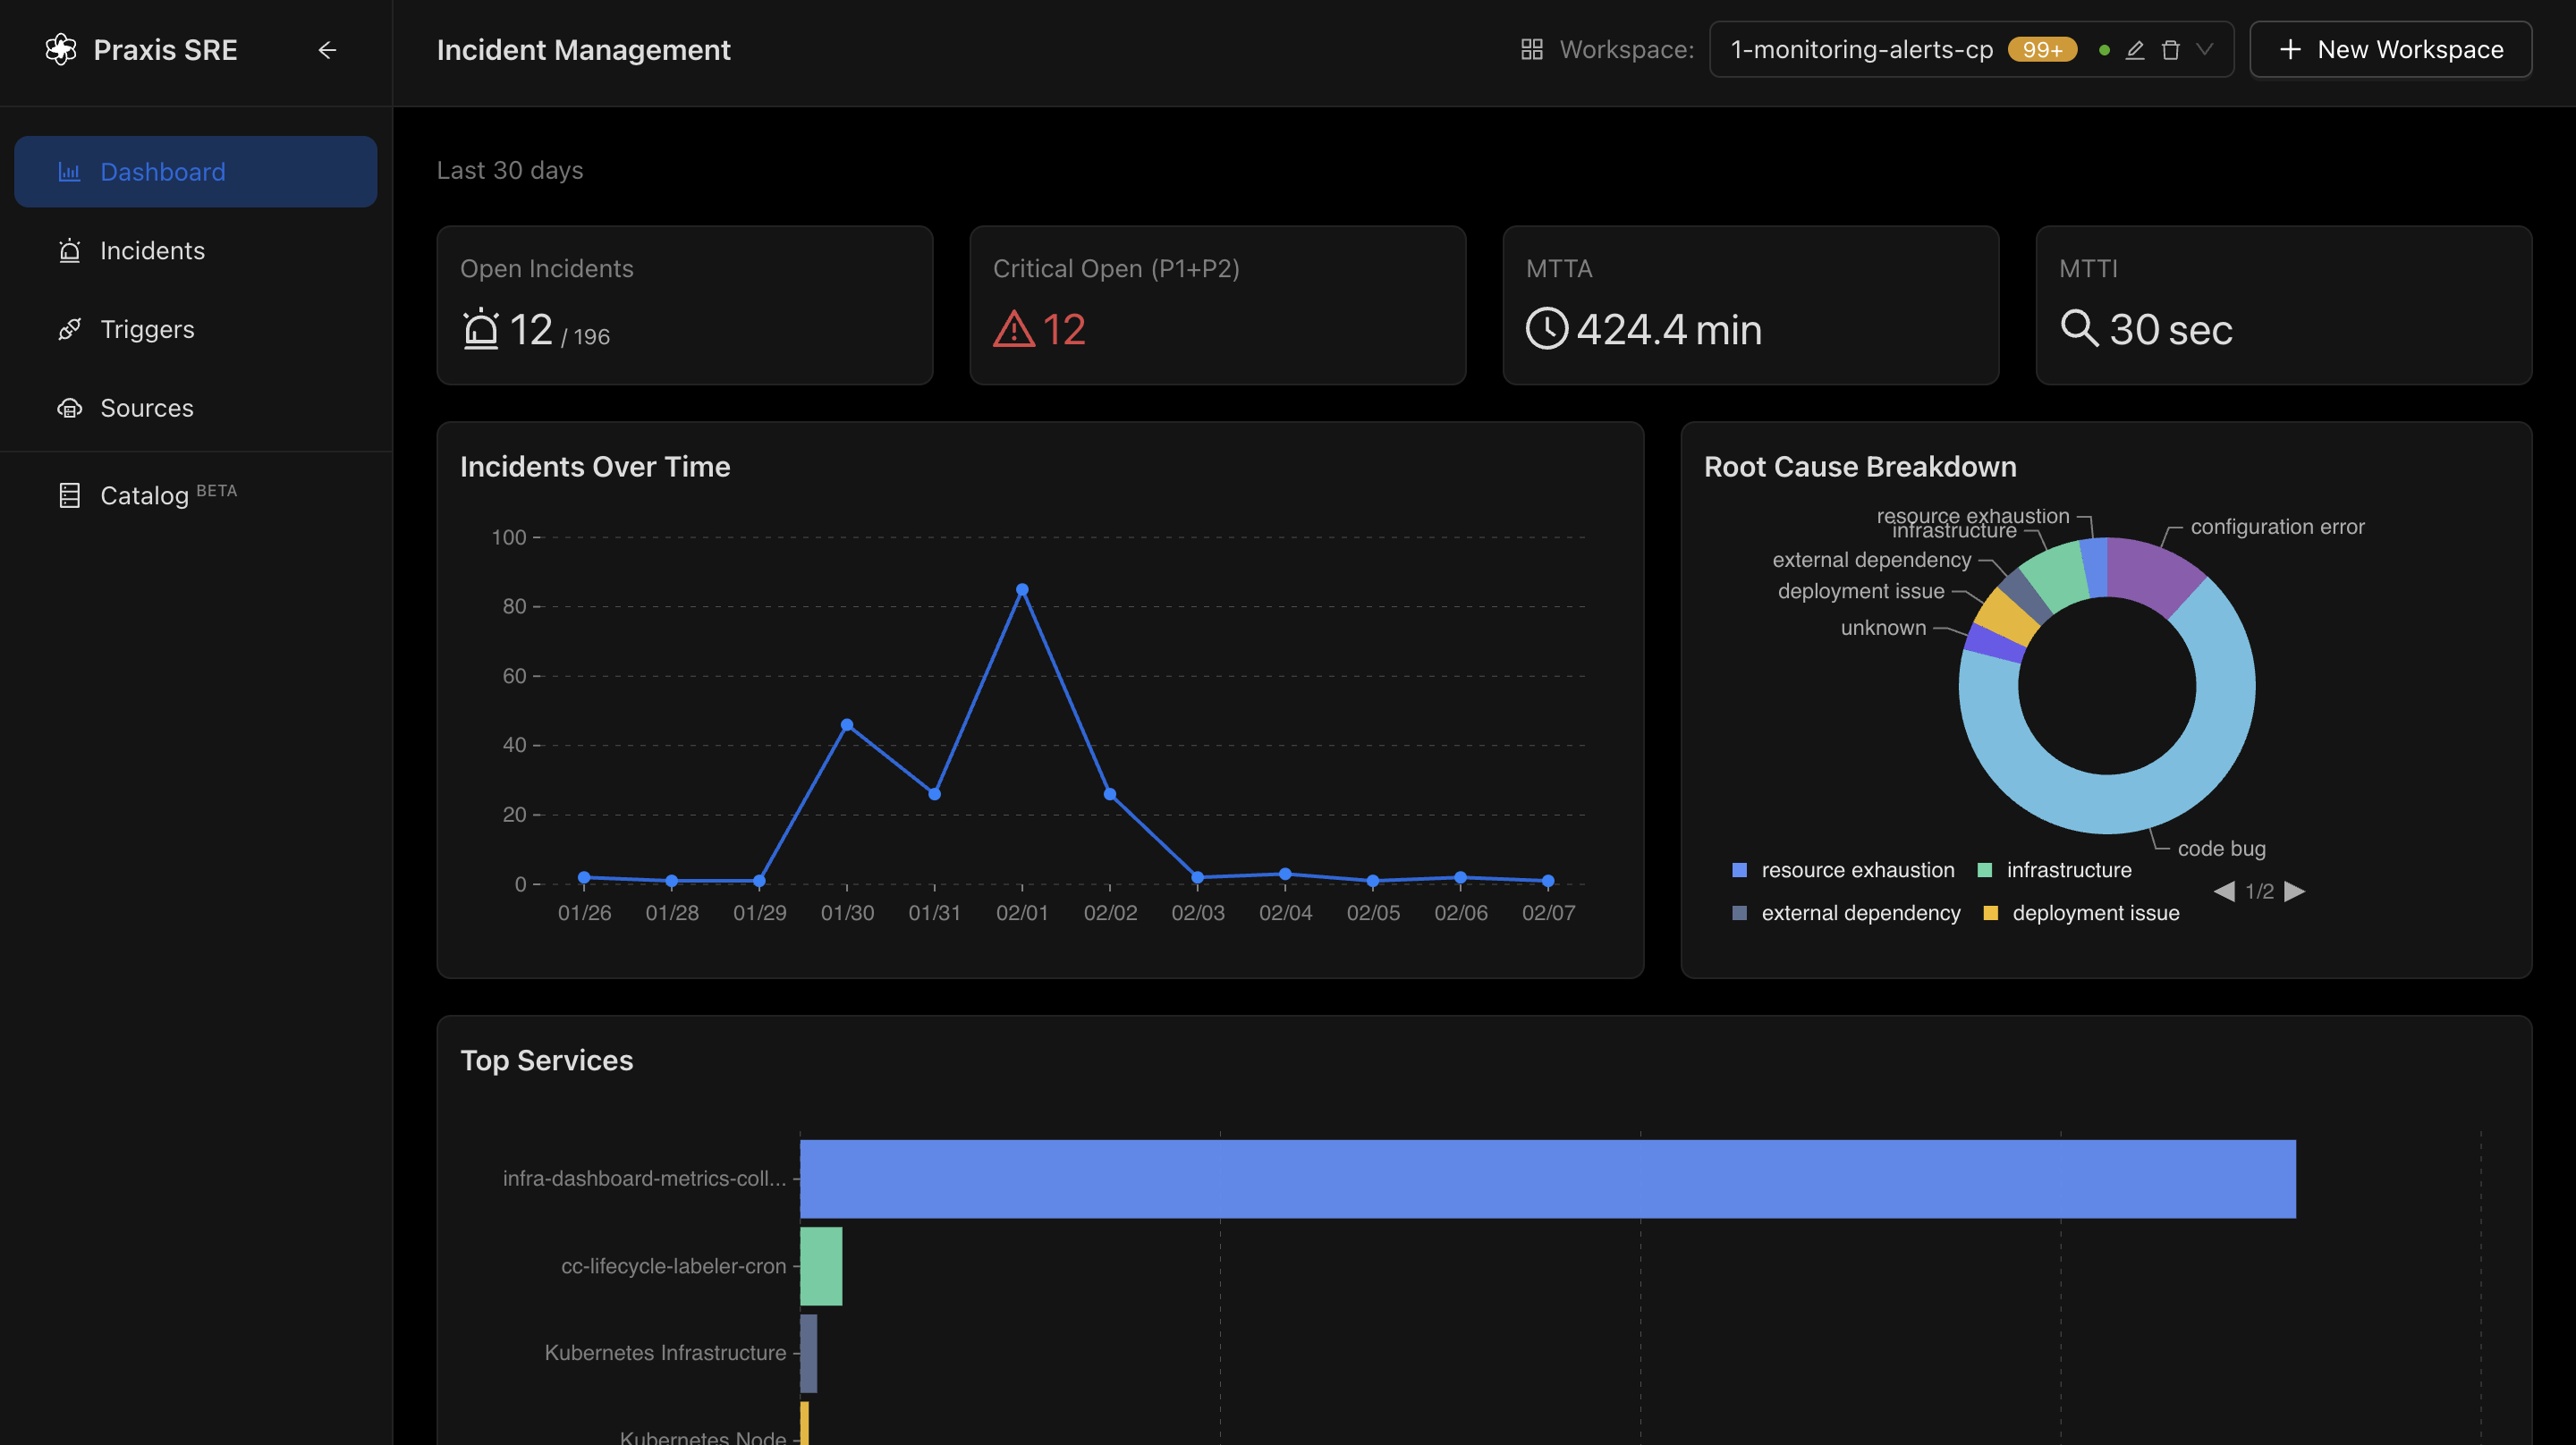
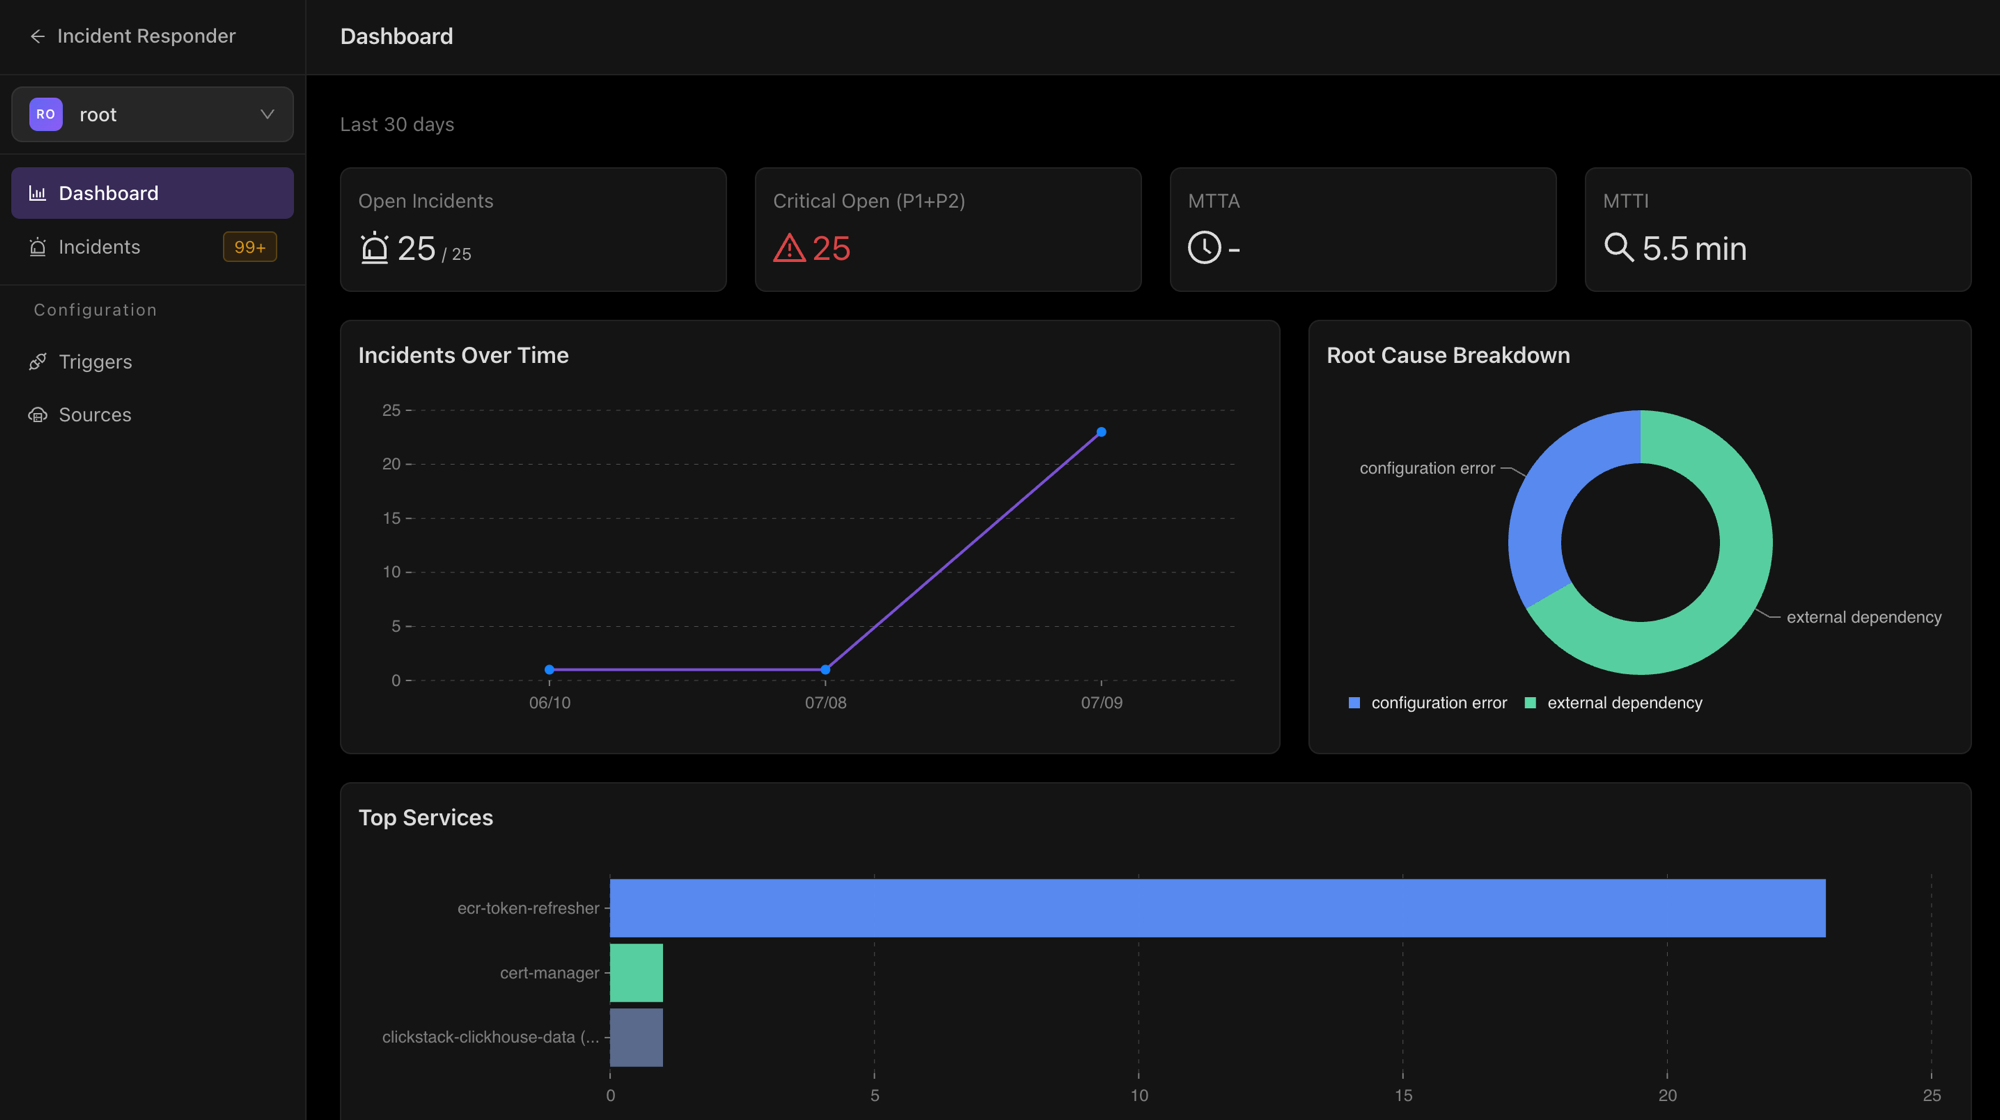
Dashboard shows stat cards for Open Incidents, Critical Open (P1+P2), MTTA, and MTTI, alongside a daily incident trend chart and a breakdown of top affected services.
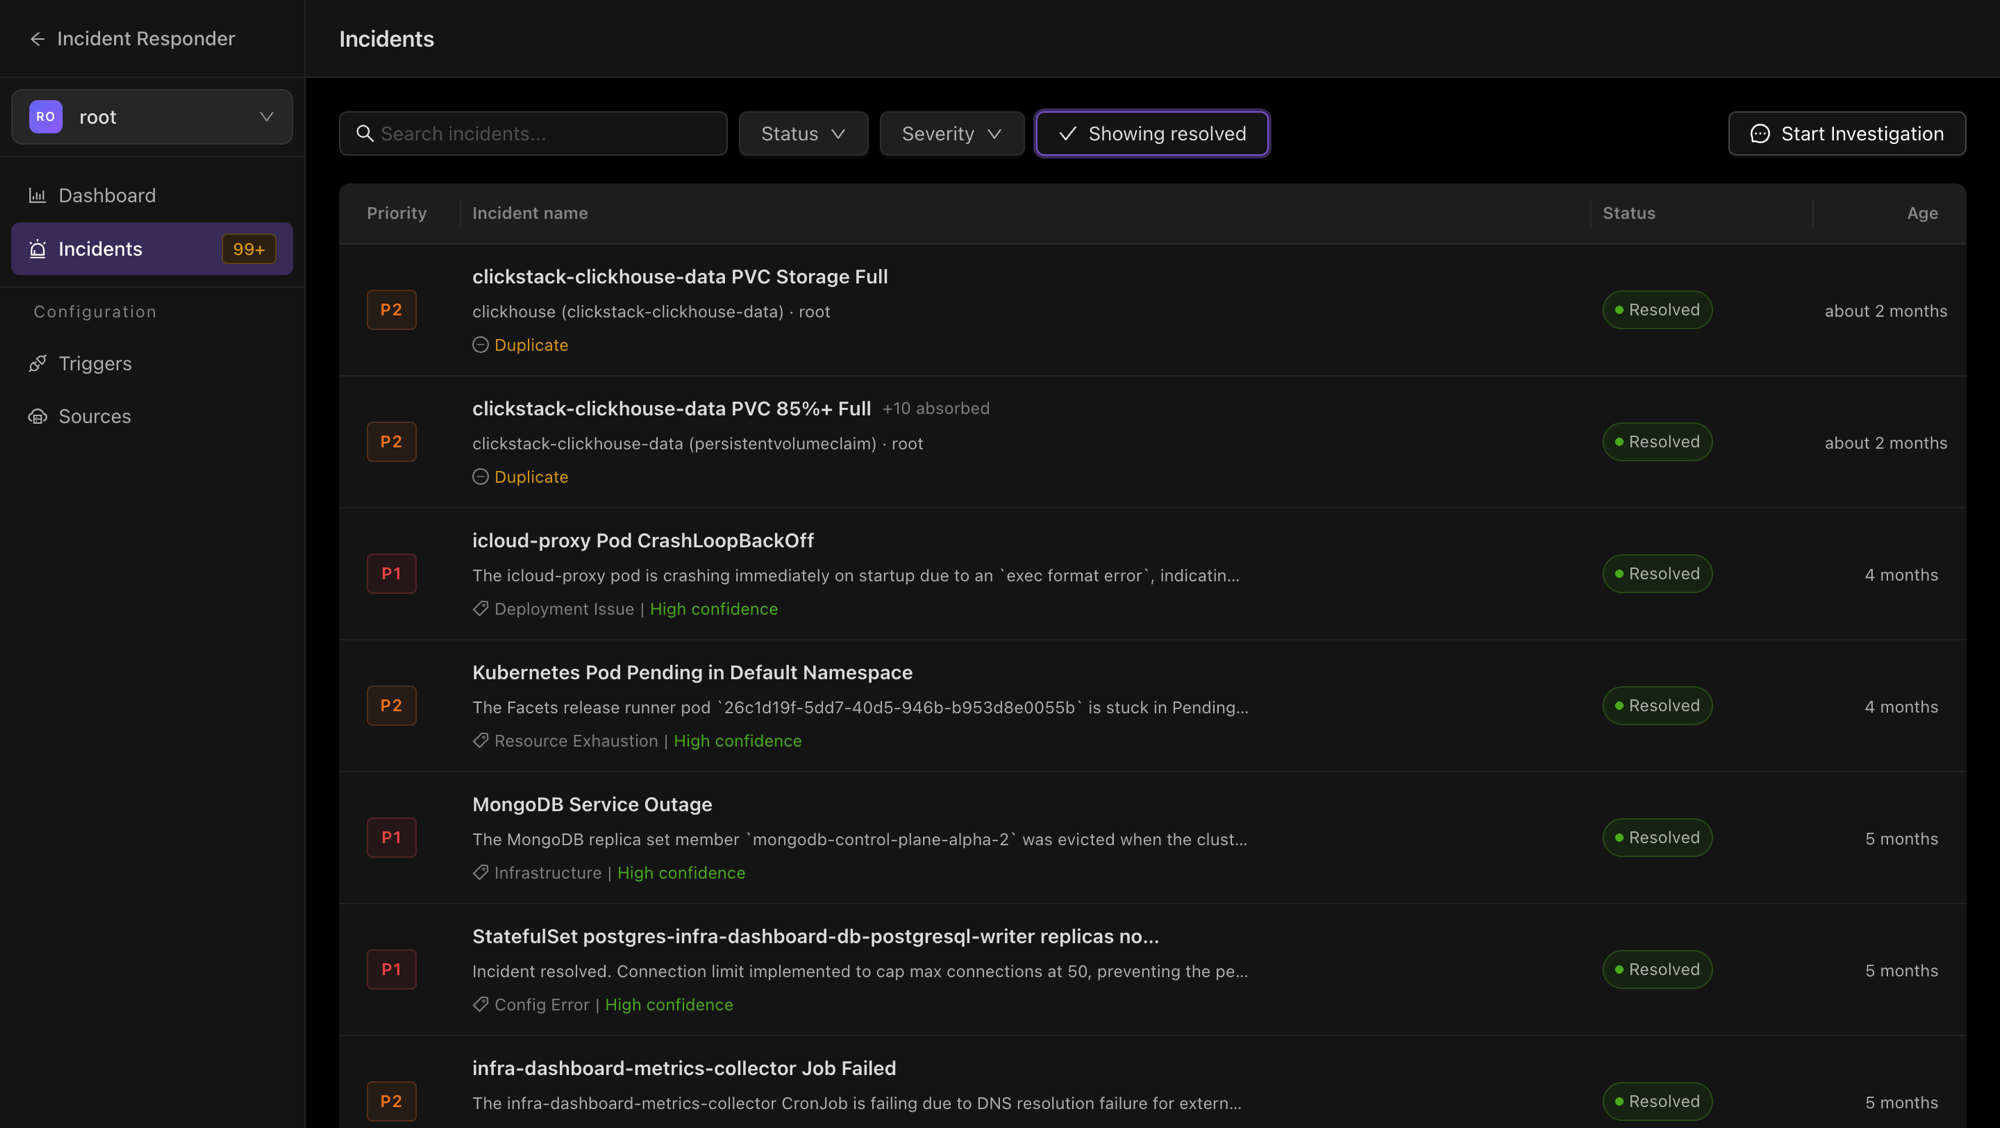
Incidents list shows every incident in the workspace, with columns for Priority, Incident name, Status, and Age. Filter by status or severity, search by text, page through results, or select Show resolved incidents to include closed incidents in the list. Clear filters resets an active filter set.
Incident detail shows an incident's severity and status, plus:
- A root-cause chain: Symptom → Immediate Cause → Root Cause → Triggered By.
- A Verification section showing the devil's-advocate challenge Praxis ran against its own hypothesis, including whether it held up or was flagged as unresolved at the retry cap.
- Affected components, recommendations, and related open incidents.
- A metadata sidebar with a lifecycle timeline.
- Lifecycle actions: Acknowledge, Resolve, and Investigate anyway to re-run the investigation. You can also override the automatic triage classification if Praxis linked an alert to the wrong incident, and copy the investigation report.
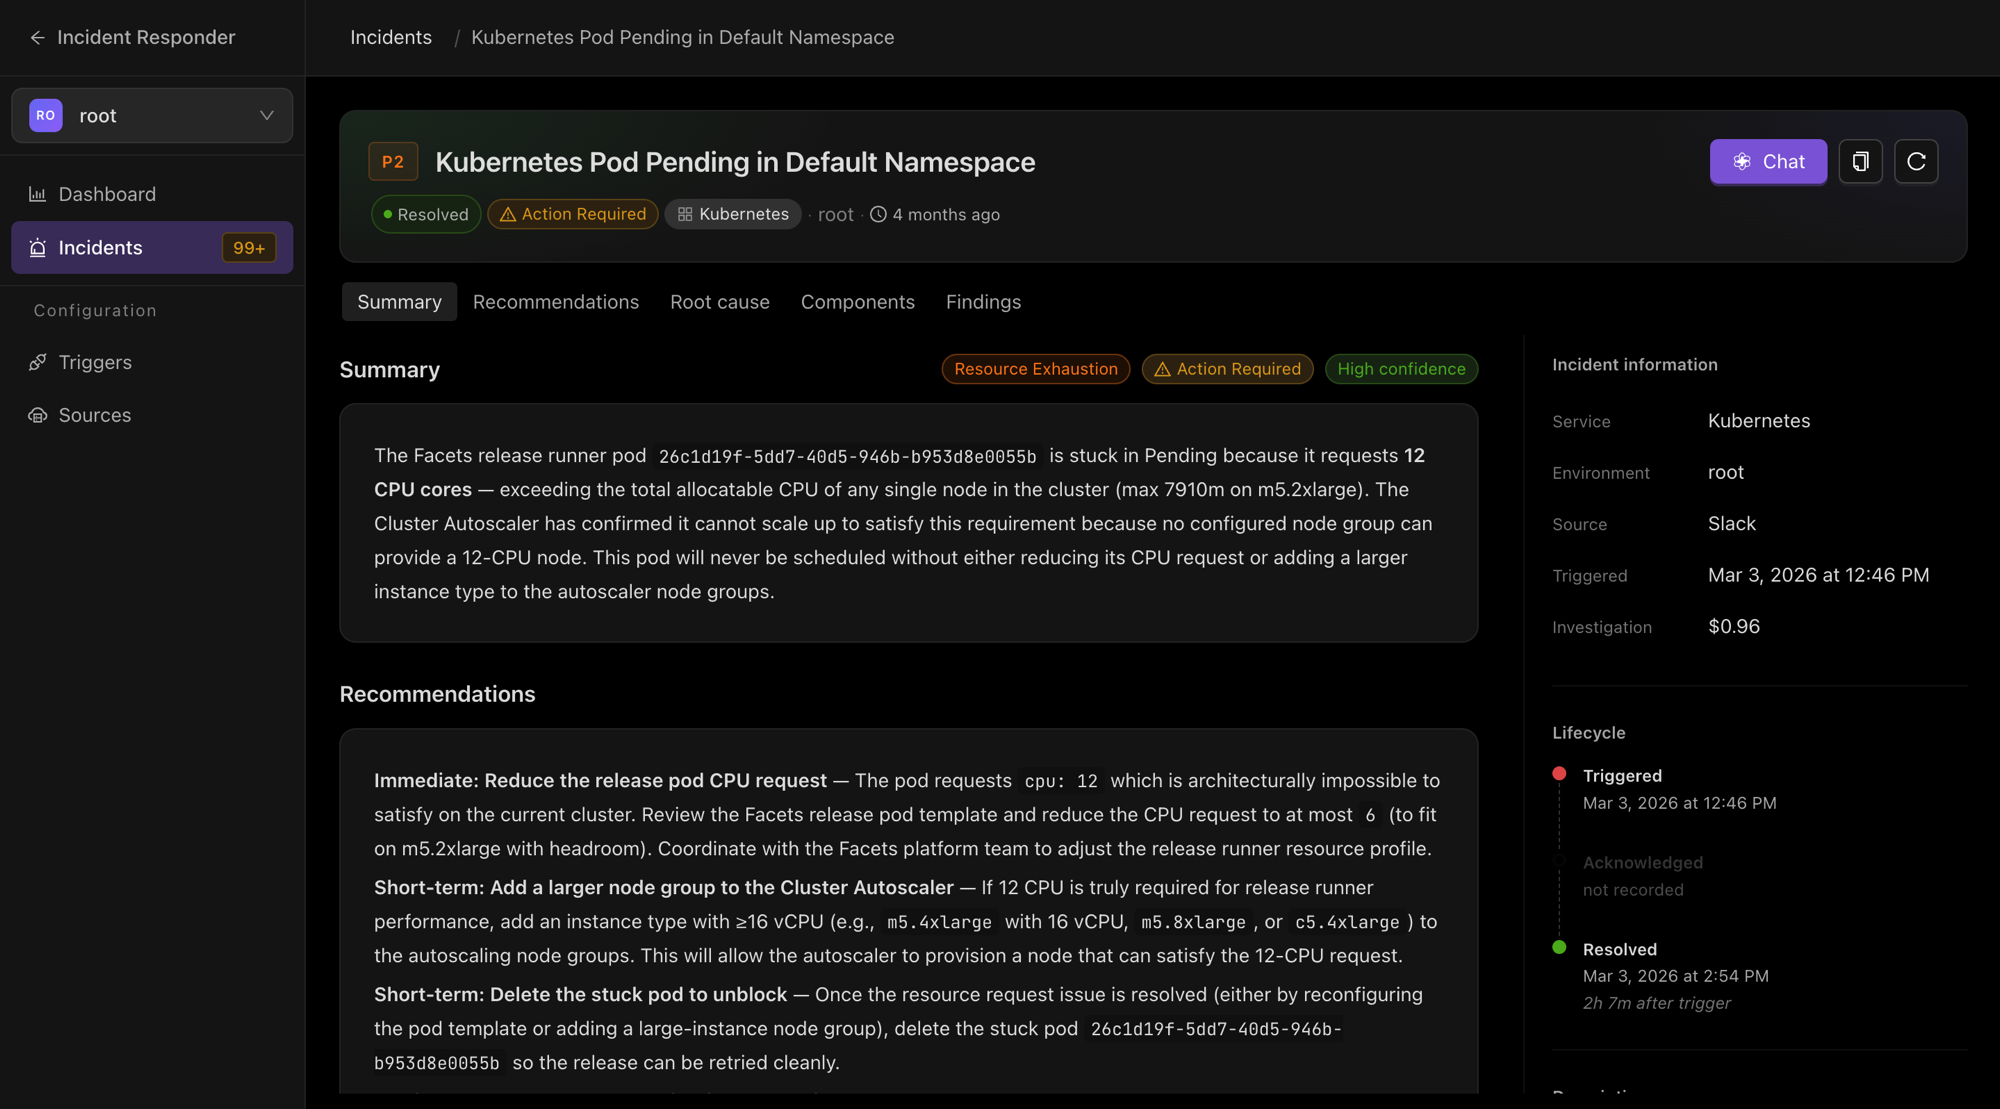
Incident status (triggered, acknowledged, resolved) is tracked separately from investigation status (not started, in progress, completed, failed, timed out, or skipped). Praxis skips an investigation when the incident was a duplicate or a downstream effect of another, when no data sources were connected, or when the organization was over its usage cap. This means a human can resolve an incident while the investigation is still running, and a failed or timed-out investigation never blocks someone from resolving the incident manually.
Setup / Configuration
Incident Responder has two separate configuration surfaces: Triggers, where alerts come from, and Sources, what data Praxis is allowed to query during investigation. Setting up one does not set up the other. You need both for Praxis to detect and investigate incidents.
Configure a Trigger
- From the workspace, open Triggers in the sidebar, or select Configure Triggers from the setup prompt.
- Choose a channel type: Slack, Mattermost, Microsoft Teams, or a generic webhook.
- Connect the channel. For a webhook, this mints an ingest URL you can point any external alerting tool at, such as PagerDuty, OpsGenie, Datadog, or Prometheus.
- Test the connection to confirm Praxis can receive messages from it.
- Optionally, define rules for which incoming messages count as alerts, so routine chatter in a channel does not create incidents.
- Pause or resume a trigger at any time without disconnecting it.
Configure a Source
- Open Sources in the sidebar.
- Connect a Kubernetes cluster under Kubernetes Sources, or a cloud account (AWS, GCP, or Azure) under Cloud Sources.
- Optionally connect a Facets environment, so Praxis can read release, resource, and variable data during investigation.
You can also set up Incident Responder conversationally. Ask Praxis in a normal chat session to create a workspace, attach a chat trigger, or mint a webhook trigger, with no need to leave the conversation to configure it through the UI.
Integrations
- Slack, Mattermost, Microsoft Teams: each can be a trigger source for new incidents, and each receives investigation results as a threaded reply in the originating conversation.
- Generic webhooks: a mintable ingest URL that any external alerting tool can send alerts to, including PagerDuty, OpsGenie, Datadog, Prometheus, or a custom sender. Native integrations with these tools are planned; for now, they connect through this URL.
- Facets Control Plane: read access to releases, resource status, resource overrides and outputs, and project variables, used to correlate an incident with recent deployments.
- AWS, GCP, Azure: read access to cloud logs and service or function status when a cloud source is connected.
- New Relic: access to APM data, NRQL queries, entities, and logs.
- Visual incident cards: Praxis can generate a visual summary of an investigated incident and post it back to the Slack thread that raised the alert. Visual cards require Slack channel and thread details, so they post to Slack only, not to Mattermost or Microsoft Teams.
Tip: You can also perform incident operations programmatically, and set up workspaces, triggers, and webhooks conversationally through chat. See the API Reference for details.
Safety Boundaries
Incident Responder investigates and recommends. It never takes action on its own.
- Read-only Kubernetes access. Praxis can only get, describe, view logs, and check resource usage on cluster objects, never run a command that changes cluster state.
- Read-only Facets Control Plane access. Praxis reads releases, resource status, and configuration through a restricted interface; it cannot run direct administrative commands against the control plane.
- No remediation, deployment, or rollback. Praxis is explicitly instructed to investigate only. It cannot restart, deploy, roll back, or modify infrastructure. A human always decides what action to take.
Beyond these app-specific limits, every investigation runs under the shared Praxis permission, credential, and isolation model. See How Praxis works.
Permissions
Every request to view or change incident data is checked against the requesting user's organization, and the target workspace must belong to that same organization. This scopes all incidents, triggers, sources, and dashboard data strictly to the organization that owns them.
Troubleshooting
| Problem | What happens |
|---|---|
| Investigation finishes without a result | Praxis retries once, then marks the incident with a fixed error message rather than leaving it in an unclear state. |
| Alert classification fails | Praxis falls back to investigating the alert directly instead of dropping it. |
| The verification challenge returns an unusable response | The challenge is treated as a "weak" result, and the raw response is kept as evidence so the investigation is not silently blocked. |
| Dashboard stats fail to load | An explicit "Failed to load dashboard" message is shown instead of a blank page. |
| A trigger or source connection fails | An "Unavailable / Retry" card is shown, and actions like testing, pausing, or resuming a trigger surface a toast error if they fail. |
Related
- How Praxis works - The shared permission, credential, and isolation model behind every Praxis app
- Alert Doctor - The Praxis app that refines a cluster's Prometheus alert rules
- K8s Inspector - Ask read-only questions about a Kubernetes cluster in chat
Databases
Create SQLite databases that Praxis hosts, attach them to your agents, and give each agent tools to store, query, and update structured data as it works.
Alert Doctor
Praxis Alert Doctor continuously reviews and refines a project's shared Prometheus alerting rules, proposing changes and applying them safely and reversibly when enabled.