Resource Live Insights & Operations
The Live tab in Facets gives real-time insights and operations for a deployed resource: pipeline activity, Kubernetes dashboard, Terraform outputs, and metrics.
The Live tab offers real-time insights and management capabilities for your cloud resources. It provides a comprehensive view of pipeline activities, Kubernetes workloads, Terraform outputs, and monitoring dashboards.
Use Cases
- Real-Time Monitoring: Observe live deployment statuses and resource metrics to ensure system health and performance.
- Deployment Management: Oversee and control deployment pipelines, including version rollbacks and promotions.
- Kubernetes Operations: Manage Kubernetes workloads with actions like rolling restarts and scaling adjustments.
- Infrastructure Outputs Access: Retrieve and utilise Terraform outputs for seamless integration and configuration.
- Resource Monitoring: Utilise Grafana-powered dashboards to monitor CPU usage, memory consumption, and pod restarts.
Functionalities
1. Pipeline Activity
This section displays the current state and version history segmented into:
- Build Registered: Tracks the changes to the artifact being deployed.
- Blueprint Activity: Monitors changes and deployments related to the blueprint configurations.
- Override Activity: Logs modifications applied to the resources as overrides.
Each category presents:
- Live Version: The version currently deployed.
- Release Pending Version: The version queued for deployment.
- Version History: An expandable table detailing past versions with timestamps and statuses.
The Version History table includes a rollback feature, allowing you to revert to a specific version if necessary.
2. Kubernetes Dashboard
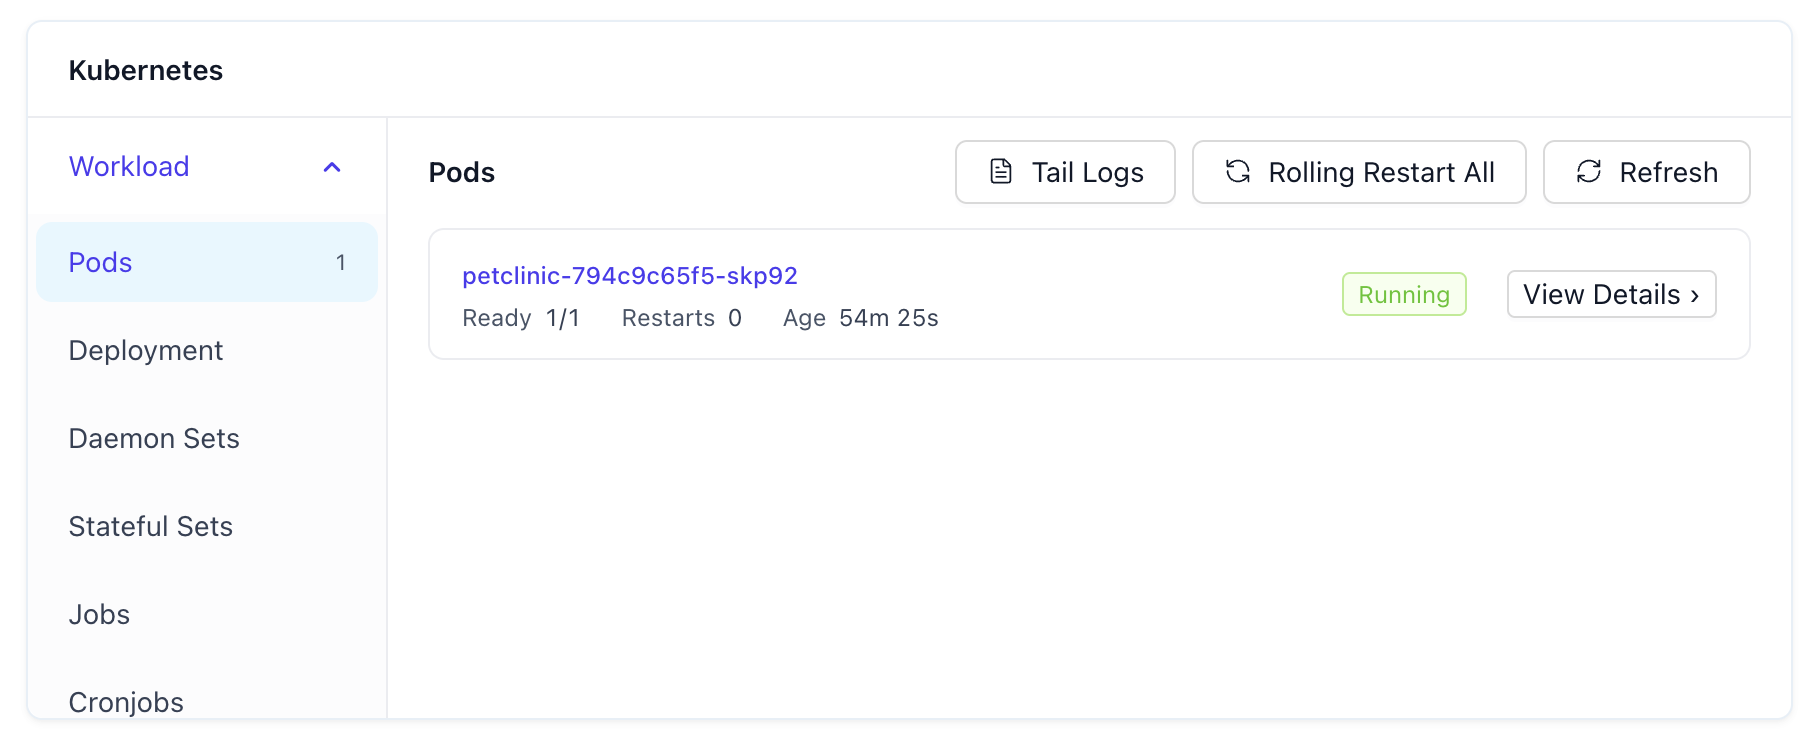
This dashboard offers a live overview of your Kubernetes cluster, covering:
-
Workloads:
- Pods: Displays status, age, restarts, readiness, and available actions.
- Deployments, DaemonSets, StatefulSets, CronJobs, Jobs: Provides insights into the state and performance of various controllers and jobs.
-
Storage:
- Persistent Volume Claims (PVCs) and Persistent Volumes (PVs): Shows storage allocations, statuses, and capacities.
-
Autoscaling:
- Horizontal Pod Autoscalers (HPAs): Monitors scaling activities and metrics.
For Pods, the following actions are available:
- Rolling Restart: Gracefully restarts pods to apply updates or recover from issues.
- Refresh: Updates the pod list to reflect the current state.
Where the resource is managed by an Argo Rollout, two further actions are available. Both act on the rollout as a whole, not on an individual pod:
- Promote: Graduates the canary or preview version to stable and scales down the previous stable pod set (Argo Rollouts blue-green and canary strategies).
- Abort: Stops the rollout in progress and scales the canary pod set down, leaving the previous stable version serving traffic.
3. Terraform Outputs
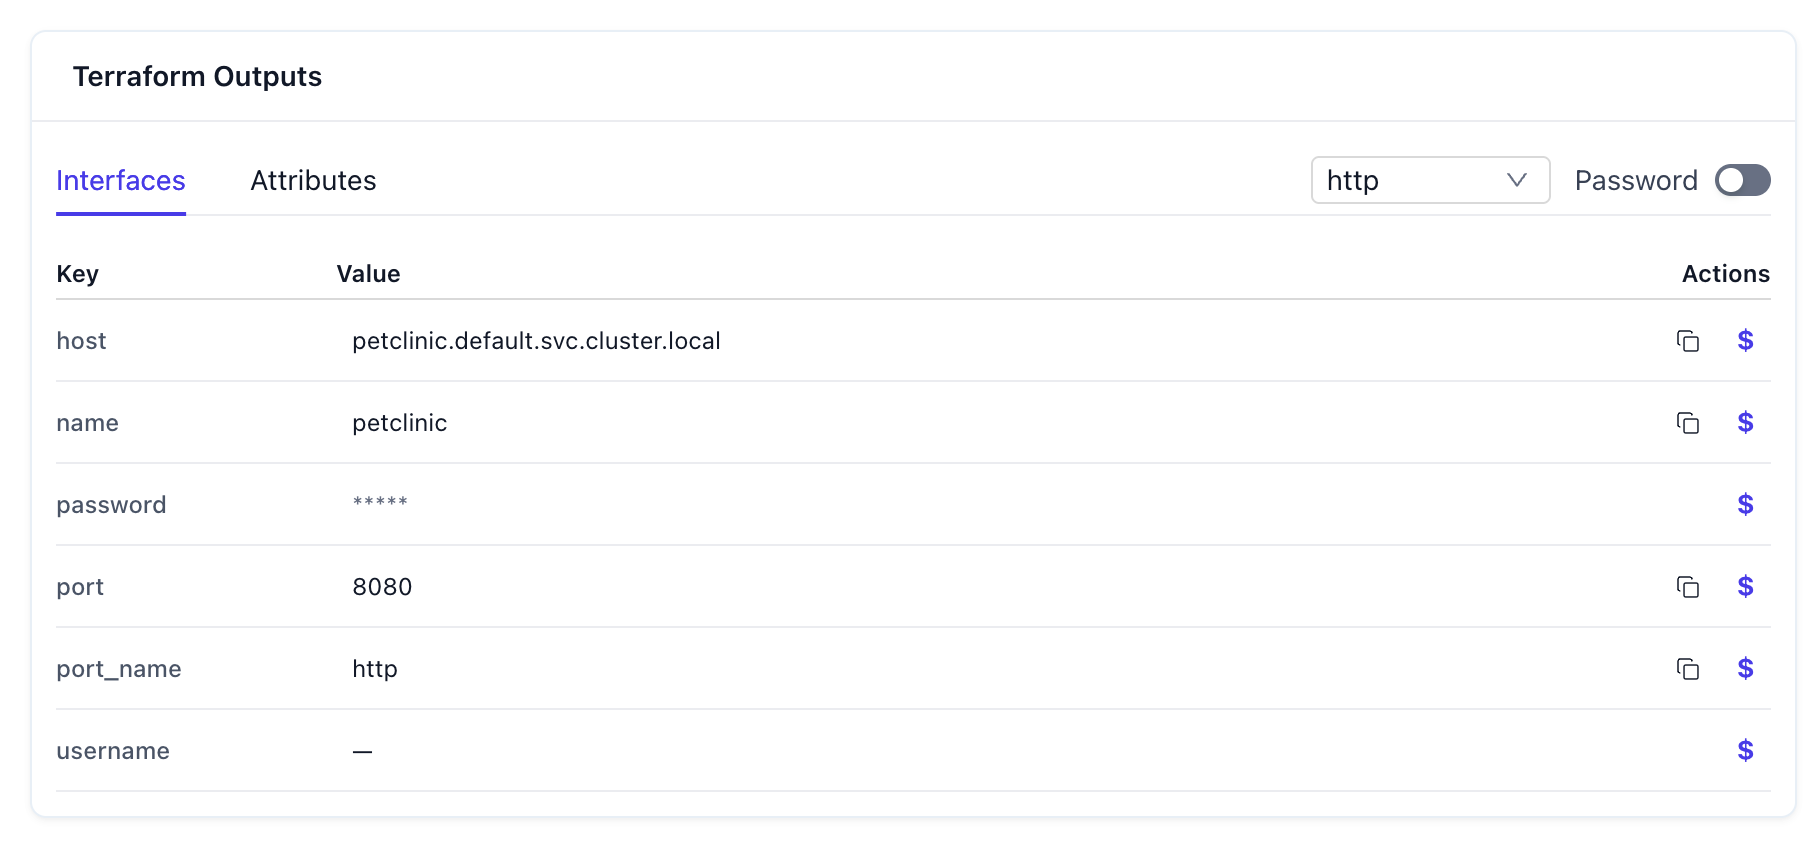
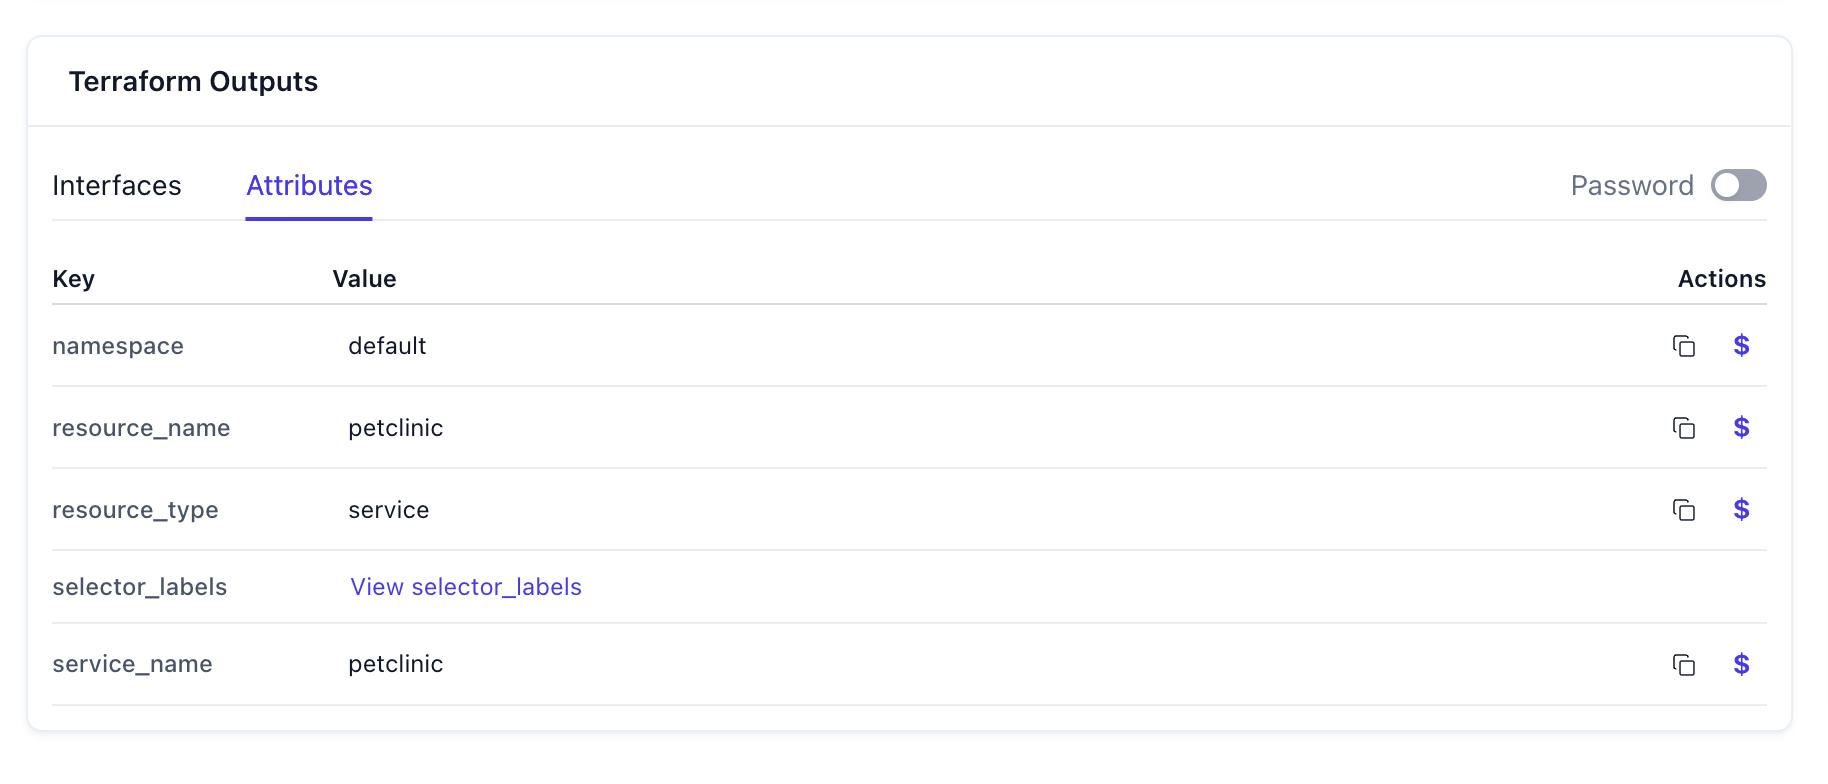
This section displays the outputs from your Terraform configurations, including:
- Interfaces: Endpoints or connection details exposed by your resources.
- Attributes: Key-value pairs representing resource properties.
Each output offers action buttons to copy names and dollar references ($refs) for seamless integration into your configurations.
Using prompt
Get the runtime outputs of service/api in dev.or
Using command
raptor get resource-outputs -p PROJECT -e ENVIRONMENT service/NAMEReturns the same interfaces and attributes for a deployed resource. -o json gives the
raw values, which is the form to use when another command or a script needs to read them.
New to the CLI? Install it first.
The Terraform Outputs section of the resource's Live tab.
4. Monitoring Dashboards
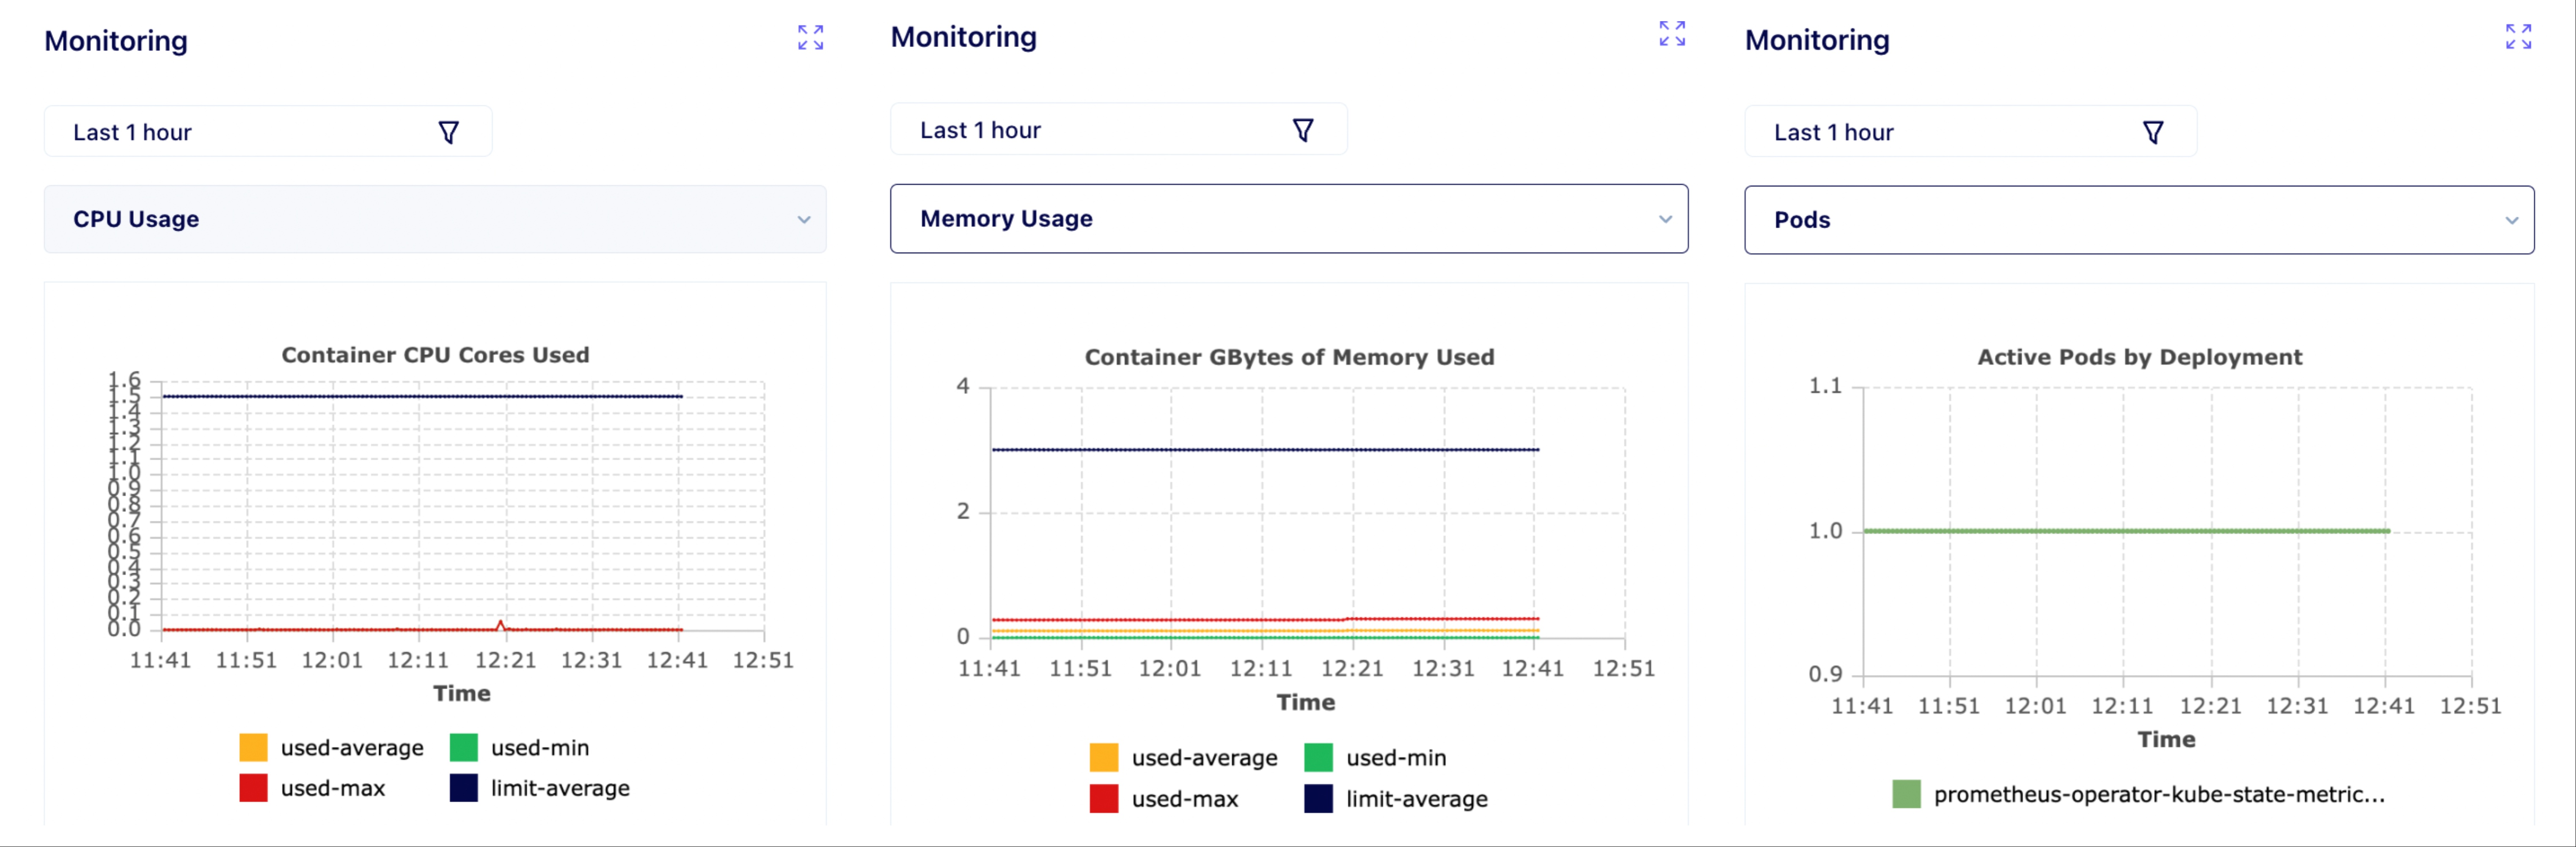
Real-time monitoring is facilitated through Grafana-powered dashboards, featuring:
- CPU Usage: Visualizes CPU consumption across your resources.
- Memory Usage: Tracks memory allocation and usage patterns.
- Pod Restarts: Monitors the frequency and reasons for pod restarts, aiding in troubleshooting.
5. Additional Dashboards
Depending on the selected resource type, additional dashboards may include:
- Ingress Overview: Details traffic routing, load balancing, and external access points.
- Historical Logs: Provides access to past logs for auditing and debugging purposes.
These dashboards adapt based on the resource type selected, ensuring relevant information is presented for effective management.
FAQs
Q1: How can I perform a rollback to a previous version?
Navigate to the Pipeline Activity section, expand the Version History table, and select the desired version to revert to using the rollback mechanism.
Q2: What actions are available for managing pods?
In the Kubernetes Dashboard, you can perform actions such as Rolling Restart, Refresh, Promote, and Abort.
Q3: What monitoring metrics are available?
The Monitoring Dashboards provide metrics on CPU Usage, Memory Usage, and Pod Restarts, visualized through Grafana dashboards.
Q4: Are the dashboards customizable?
Dashboards are tailored based on the selected resource type, ensuring relevant information is displayed for effective management.
Troubleshooting
Issue: Changes are not reflecting in the Kubernetes Dashboard.
- Solution: Ensure you have clicked the Refresh action to update the pod list. If the issue persists, verify your Kubernetes cluster's connectivity and health.
Issue: Unable to perform a rollback to a previous version.
- Solution: Confirm that the desired version is listed in the Version History. If it's unavailable, the version may not be eligible for rollback.
Issue: Terraform outputs are not displaying correctly.
- Solution: Check that your Terraform configurations have been applied successfully. Re-run the Terraform apply process if necessary and refresh the Live tab.
Resource center
The Resource Center is the environment-level hub in Facets for listing resources and inspecting their live monitoring, overrides, and release history.
Overriding Resources
Override resource configuration per environment in Facets without changing the blueprint, using Form or JSON mode, version history, and rollback.